What vibe-view can show you
A QVF archive is a set of independent sections, each declaring a kind.
The viewer keeps one explicit registry of the kinds it renders
(vibeview.kinds.SUPPORTED_KINDS), and every file you open prints a banner
listing its sections and what will happen to each one:
╔══════════════════════════════════════════════════════════════════════════════╗
║  QVF file: h2o.qvf                                                           ║
║  Source:   vibe-qc 0.16.0 — RKS/PBE                                          ║
╠══════════════════════════════════════════════════════════════════════════════╣
║  Section ID          Kind                         Status                     ║
╠══════════════════════════════════════════════════════════════════════════════╣
║  struct_0            structure                    rendered                   ║
║  vol_homo            volume.orbital               rendered                   ║
║  x_orca_gbw          x_orca.gbw                   skipped, vendor namespace  ║
╚══════════════════════════════════════════════════════════════════════════════╝
That banner is the honest answer to “is my data actually being displayed?” — nothing is silently dropped. A section is reported as one of:
Status |
Meaning |
|---|---|
|
The viewer has a renderer for this kind |
|
The format defines the kind and the producer emits it, but no renderer exists yet |
|
The kind is not in the registry at all |
|
An |
|
The section’s payload does not match its declared digest, so it is not used |
Structure and geometry
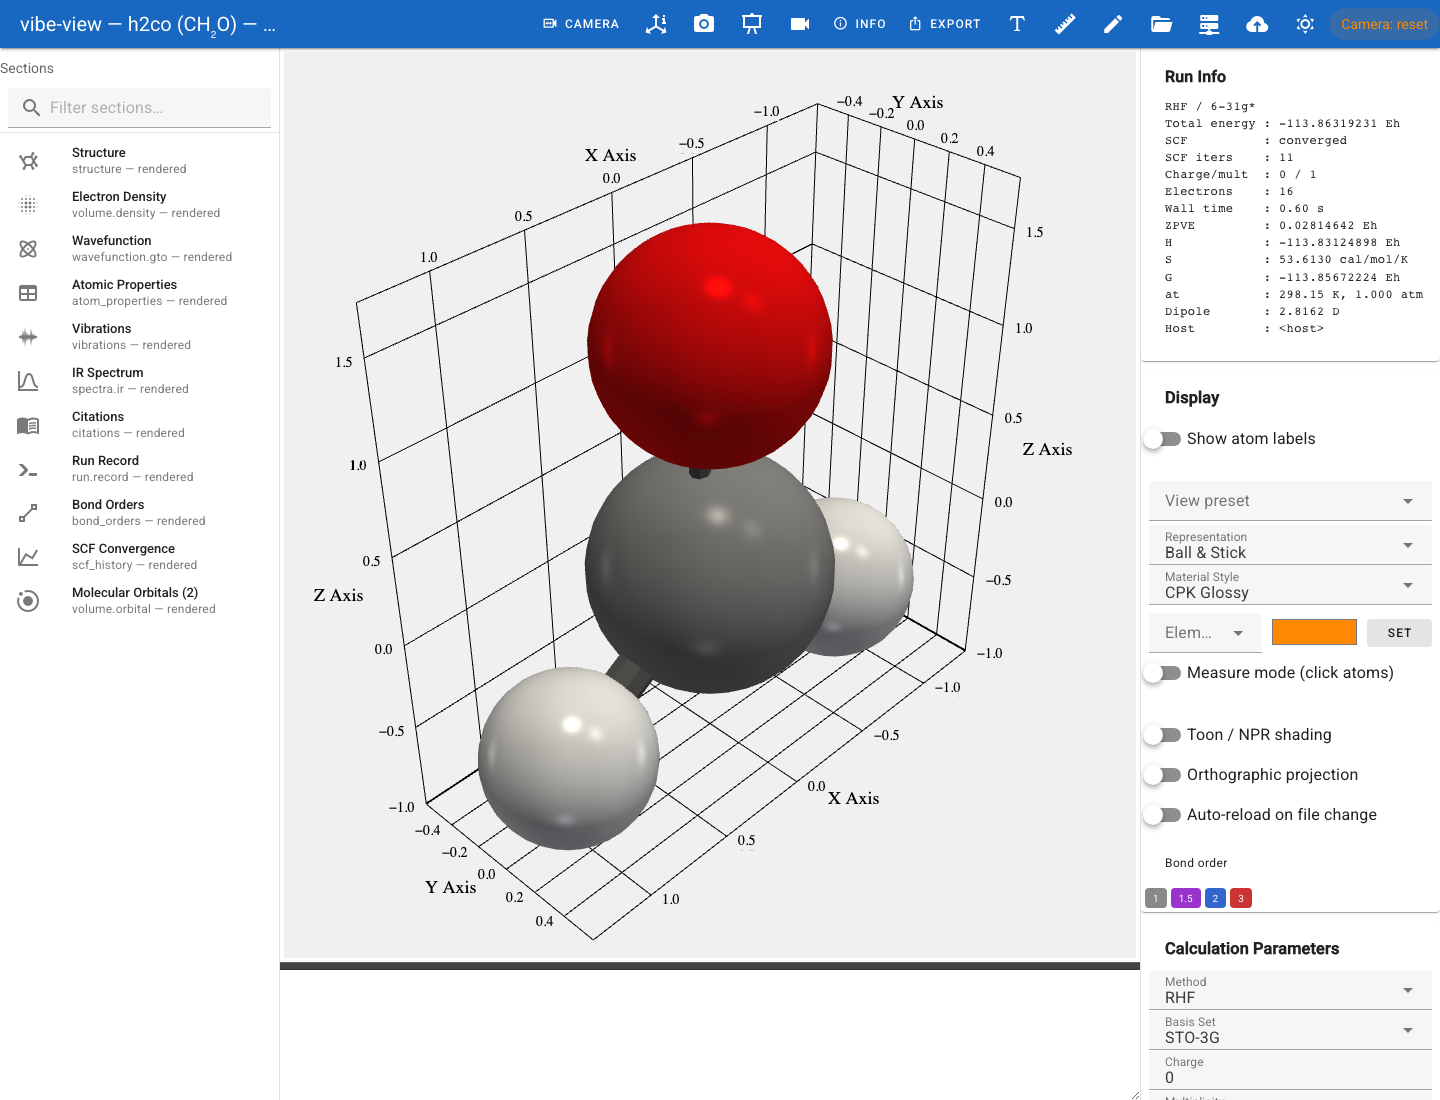
A formaldehyde structure from a vibe-qc calculation, with the light background selected.
Kind |
What you get |
|---|---|
|
CPK-coloured atoms in ball-and-stick, space-filling or wireframe. Optional chains, residues and secondary structure drive cartoon rendering for biomolecules. |
|
Folded into the structure section and drawn by the structure renderer — explicit connectivity is never dropped. |
|
Detected point group, with the symmetry elements drawn in place. |
|
Per-atom scalars (charges, spin densities, …) as a table and as atom colouring. |
|
Mayer / Wiberg analysis. |
|
Critical points and bond paths. |
Structures can be measured (distances, angles, dihedrals), clipped by a plane,
aligned across files with Kabsch superposition, replicated into a supercell,
and edited — the browser and desktop surfaces carry a full atom editor with
undo/redo, a fragment library, a crystal builder and SMILES-based construction
(via the [smiles] extra).
QTAIM topology
A topology.qtaim section adds critical points and bond paths to the molecular
scene. Its table shows density, the density Laplacian and ellipticity where
the producer supplies them.
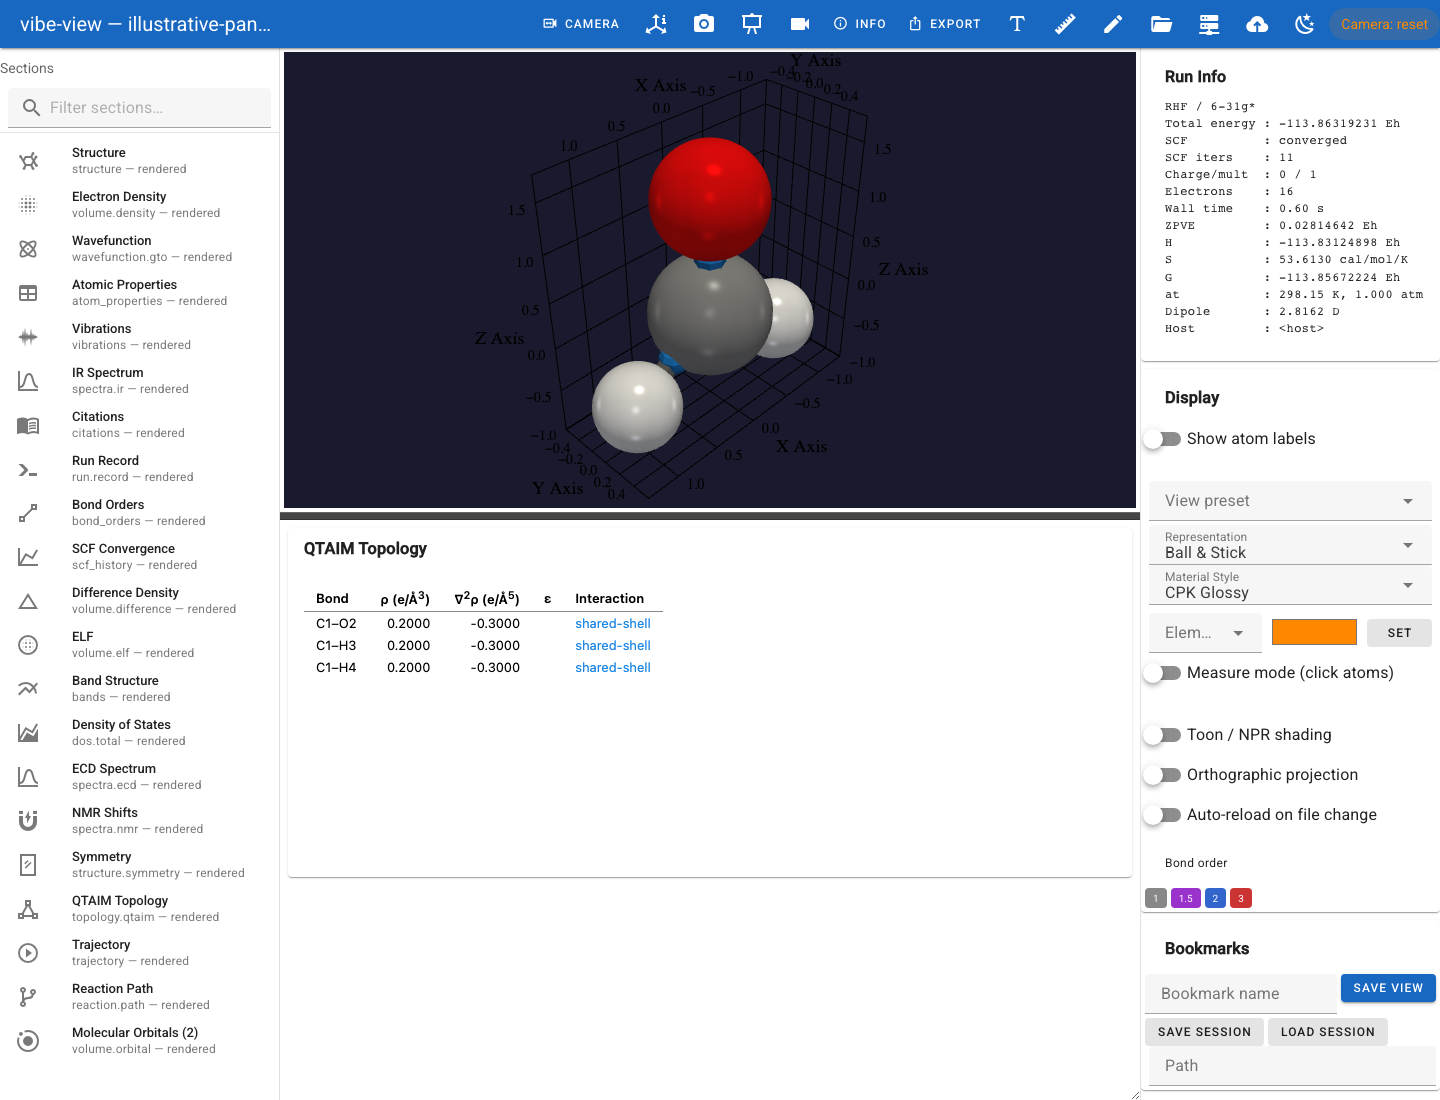
The actual QTAIM viewer with an explicitly illustrative topology fixture; the values shown are demonstration data, not a calculated topology.
Volumetric fields
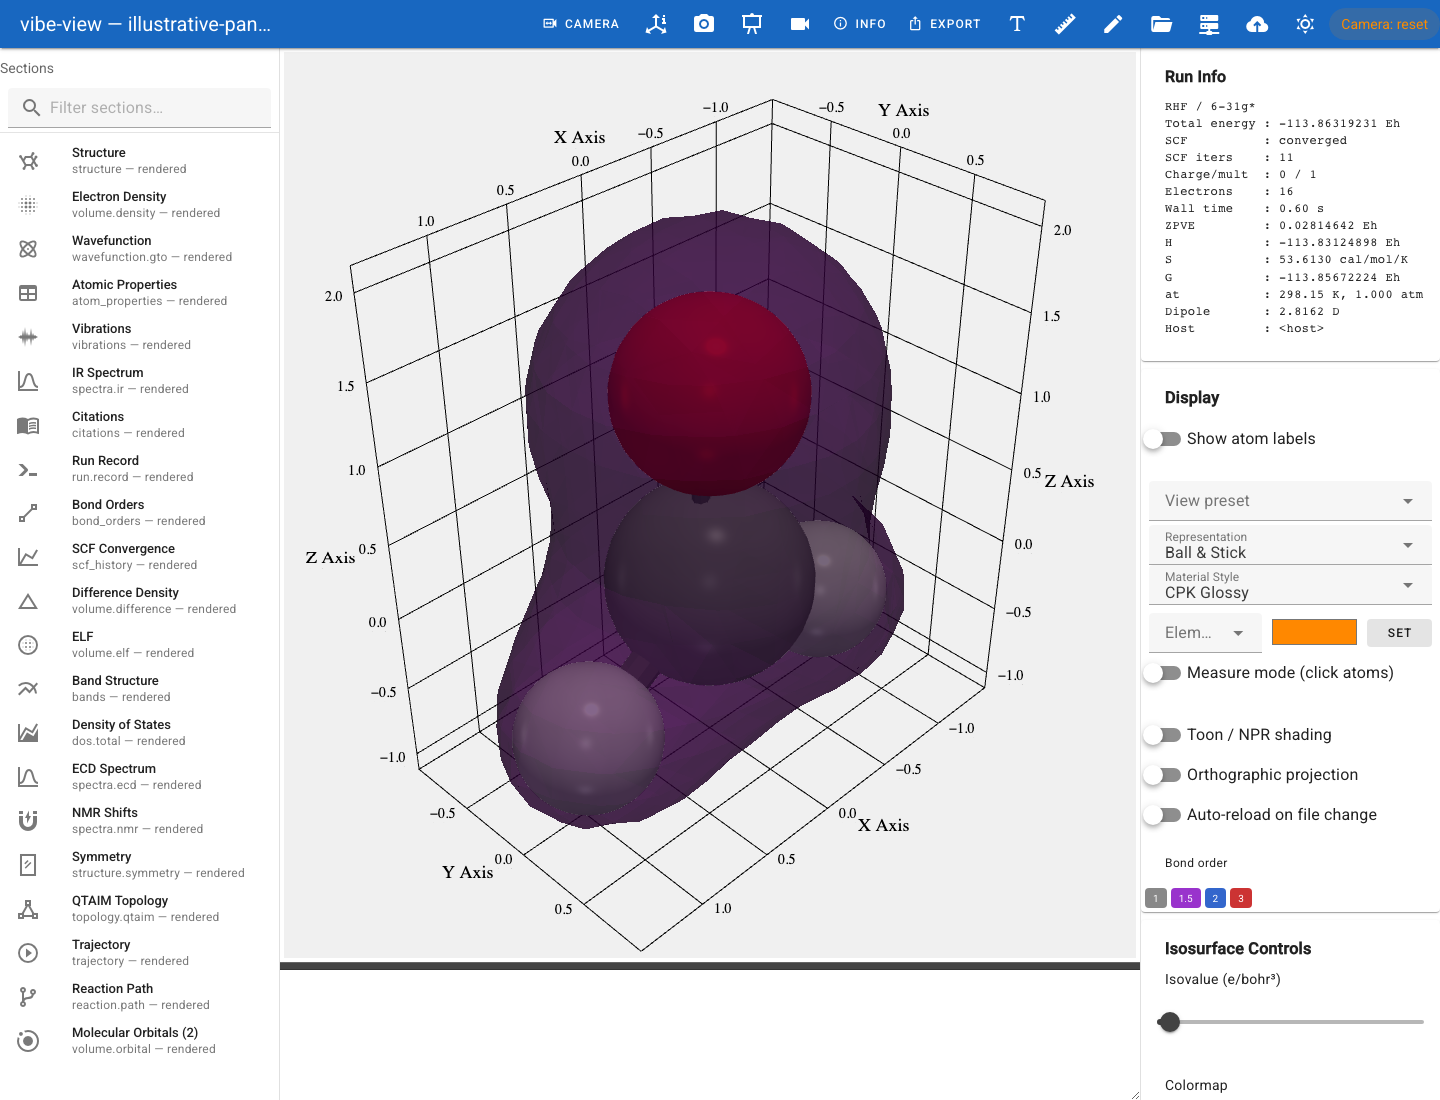
Computed electron density from the formaldehyde showcase archive.
All of these use the same isosurface renderer, with an adjustable isovalue and colormap, and all are lazy-loaded: the binary payload is read from the zip on first activation, not at file-open time, so opening a file with a dozen orbitals in it is instant.
Kind |
What it is |
|---|---|
|
Electron density |
|
Molecular orbitals, with signed-lobe rendering |
|
Spin density |
|
Difference densities |
|
Electron localization function |
|
Electrostatic potential |
|
Reduced density gradient — non-covalent interaction analysis |
|
Anything else on a grid |
Wavefunctions, evaluated on demand
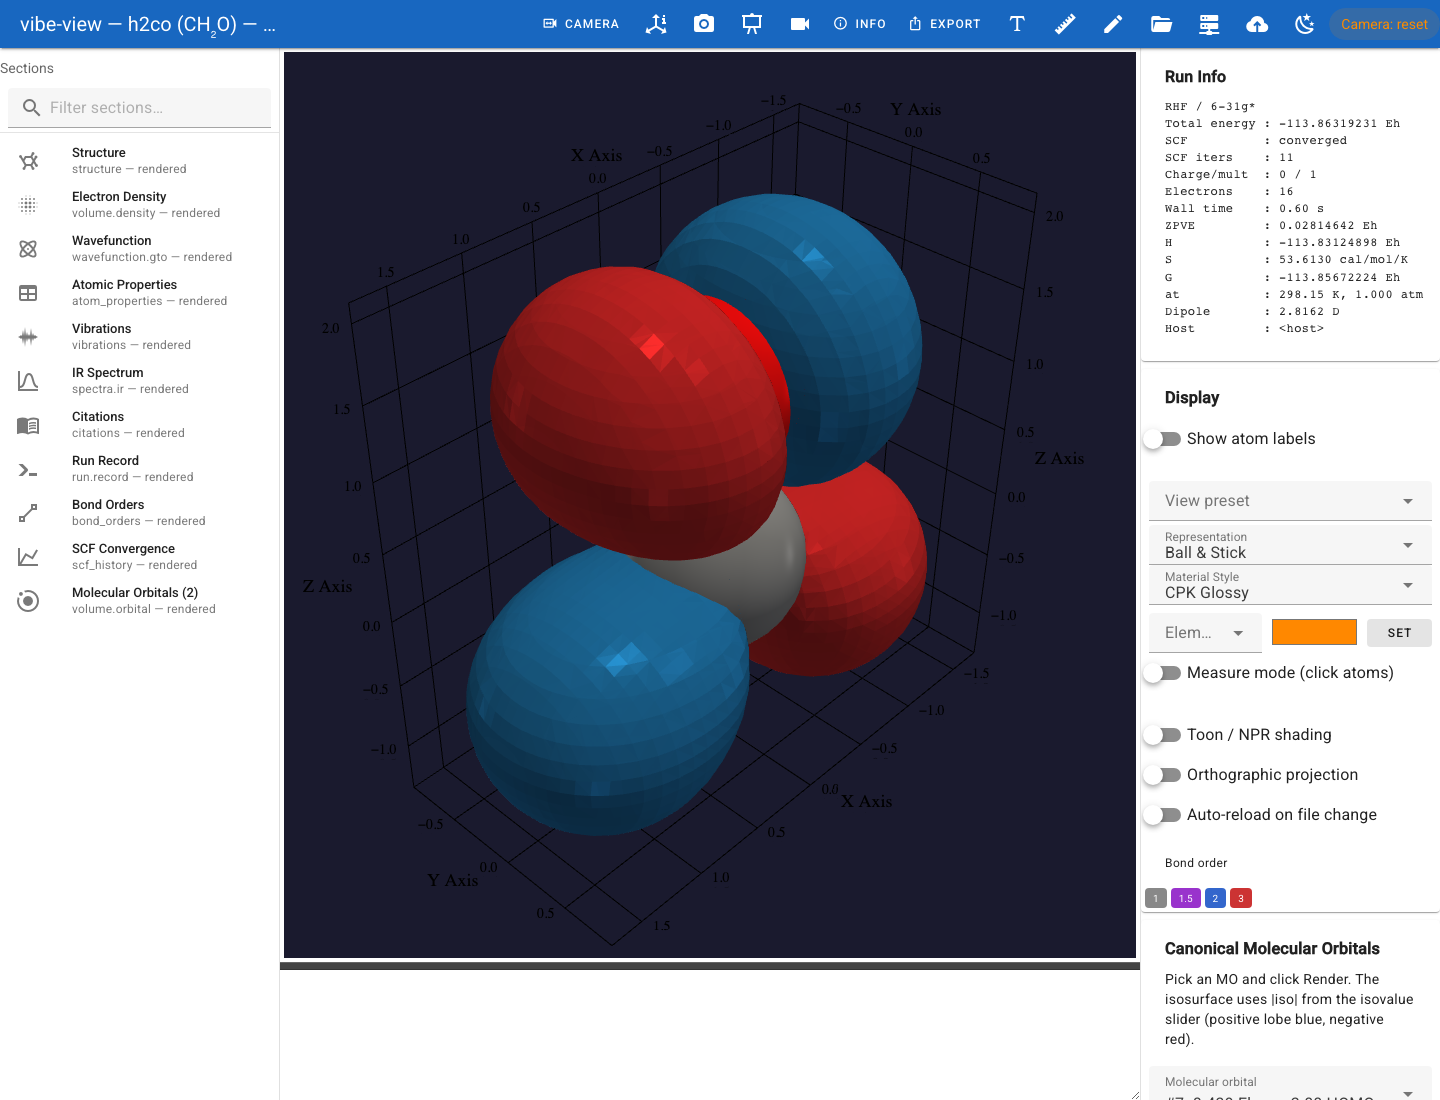
The formaldehyde HOMO, evaluated from the wavefunction stored in the QVF.
wavefunction.gto carries the GTO basis and MO coefficients rather than a
pre-computed grid, so the viewer can evaluate any orbital on demand
instead of only the ones the producer chose to ship. That covers canonical,
alpha/beta, natural and localized sets, plus computed density.
Two limits are worth knowing: on-demand evaluation covers shells through
l = 3, and periodic Gamma-point fields omit image-AO tails. The status line
says so when a surface is incomplete rather than quietly drawing a wrong one.
The related basis.ao kind carries atomic-orbital data and is lazy-loaded on
the same terms.
Periodic systems
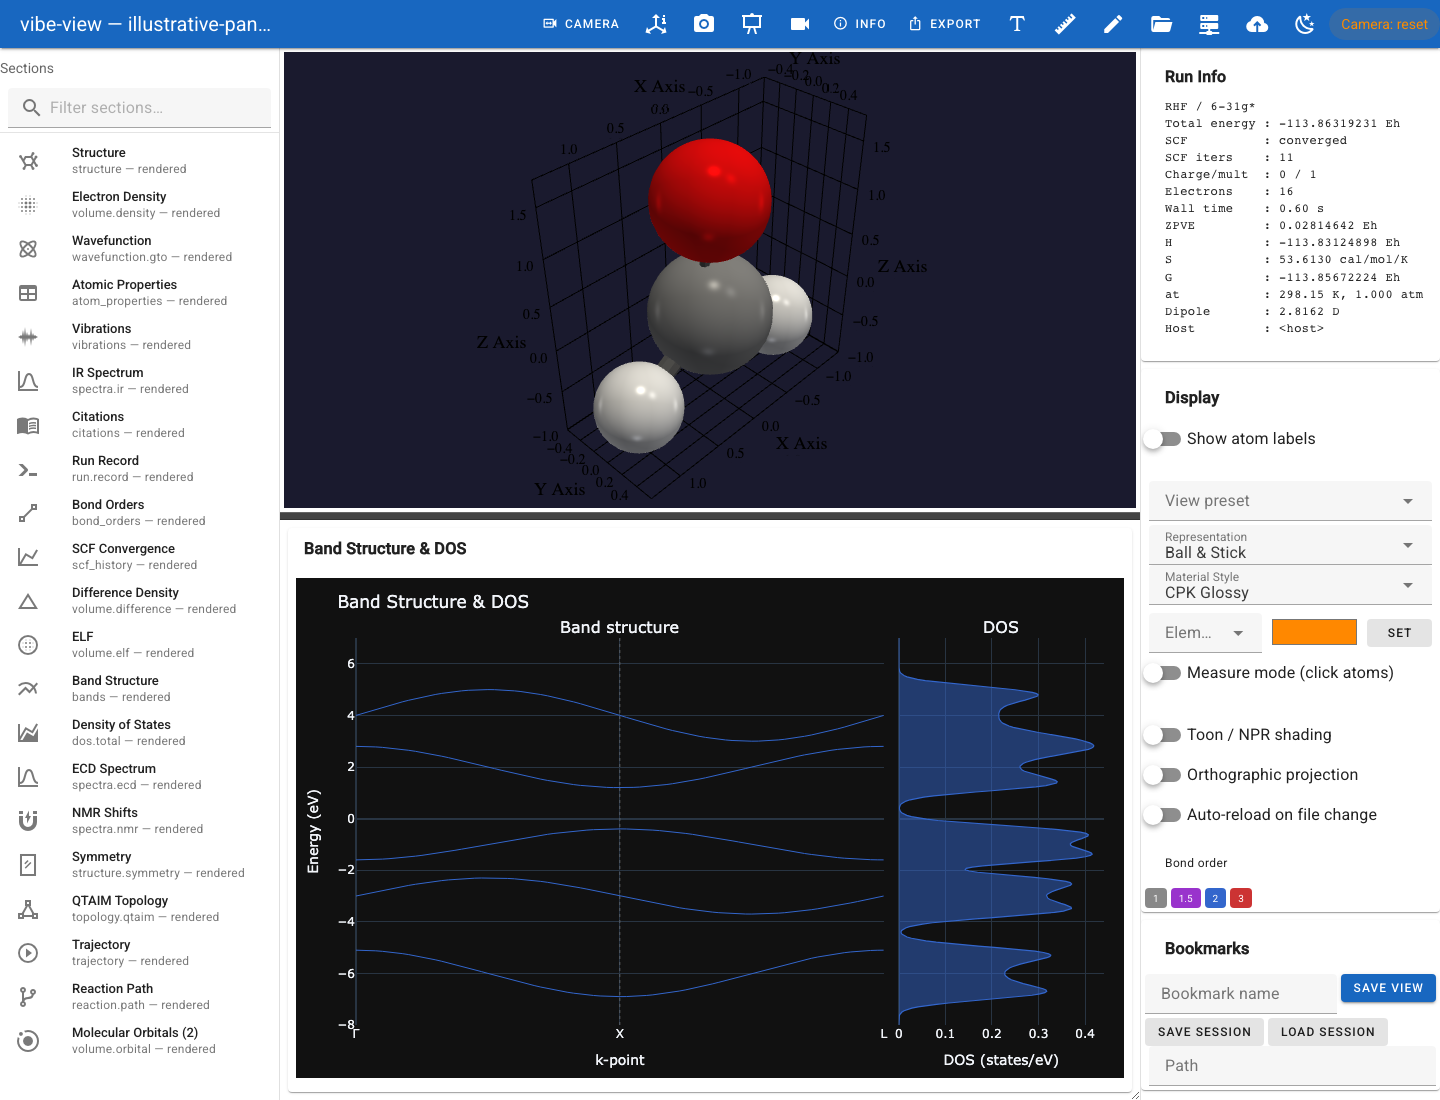
An illustrative band/DOS fixture demonstrates the combined panel; these curves are not a material calculation.
Kind |
What you get |
|---|---|
|
Electronic band structure, interactive, with the Fermi level marked and an adjustable energy window |
|
Total and projected density of states, on the same energy window |
|
Crystal orbital overlap / Hamilton populations |
|
Phonon dispersion and density of states |
|
The Fermi surface in reciprocal space |
|
E(V) curves and fitted parameters |
Spectra
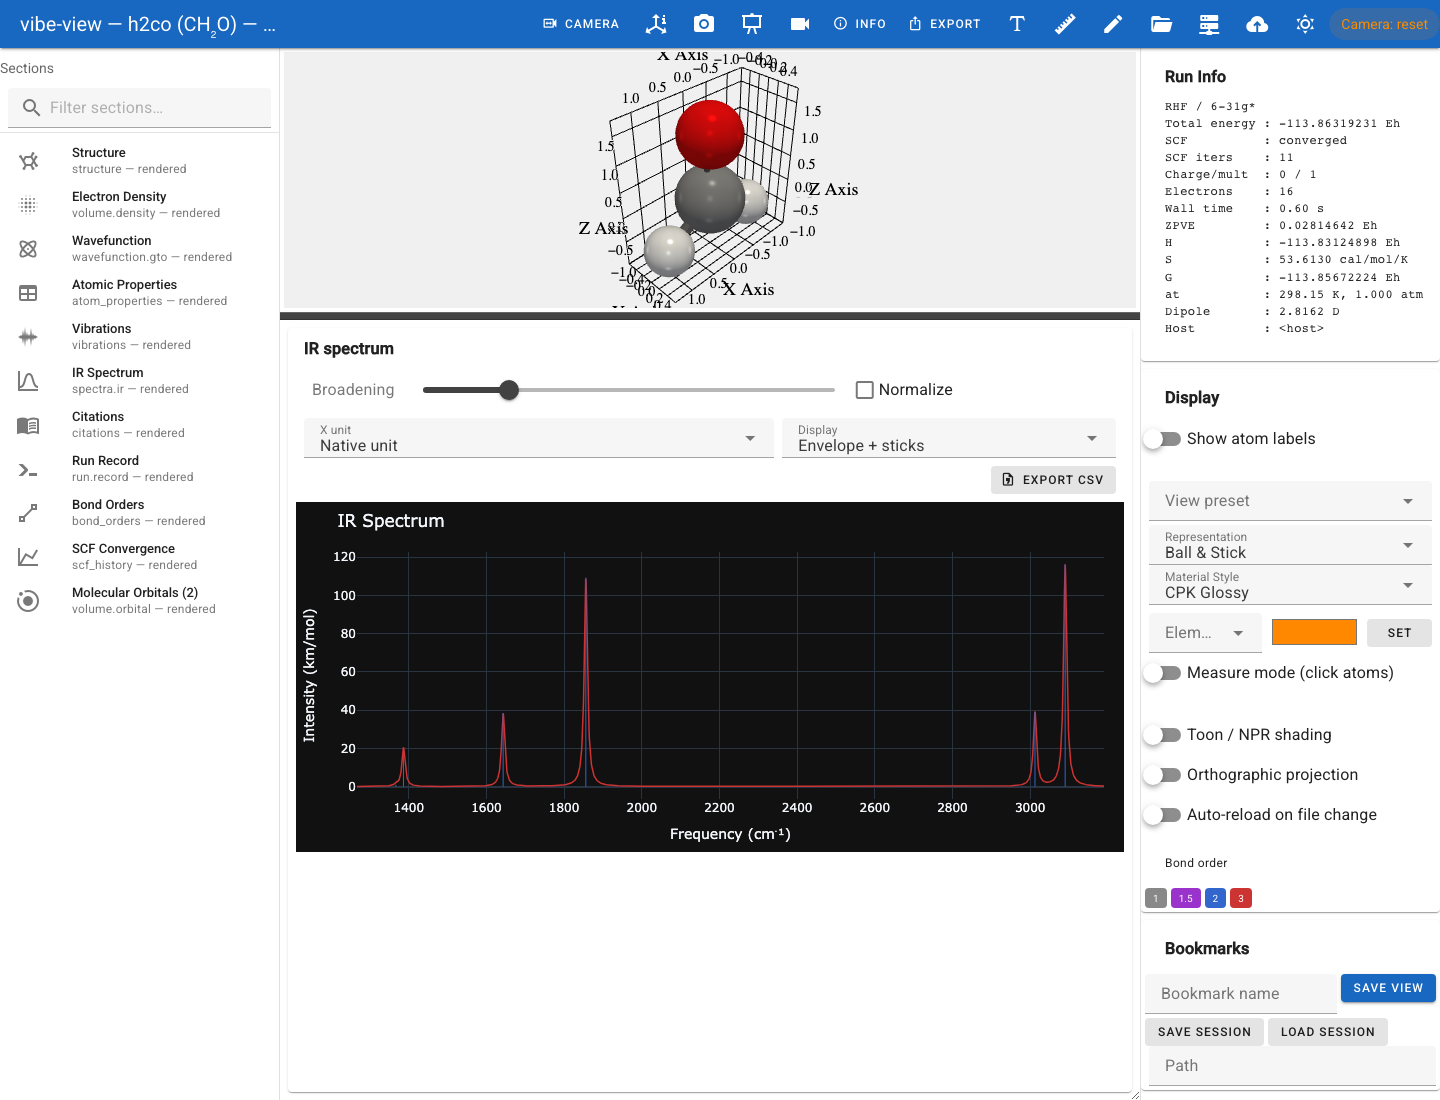
The computed IR spectrum from the formaldehyde showcase archive.
spectra.ir, spectra.uvvis, spectra.raman, spectra.ecd, spectra.vcd,
spectra.nmr, spectra.epr and spectra.generic all render as interactive
stem plots with hover tooltips, on a shared renderer.
Things that change over a coordinate
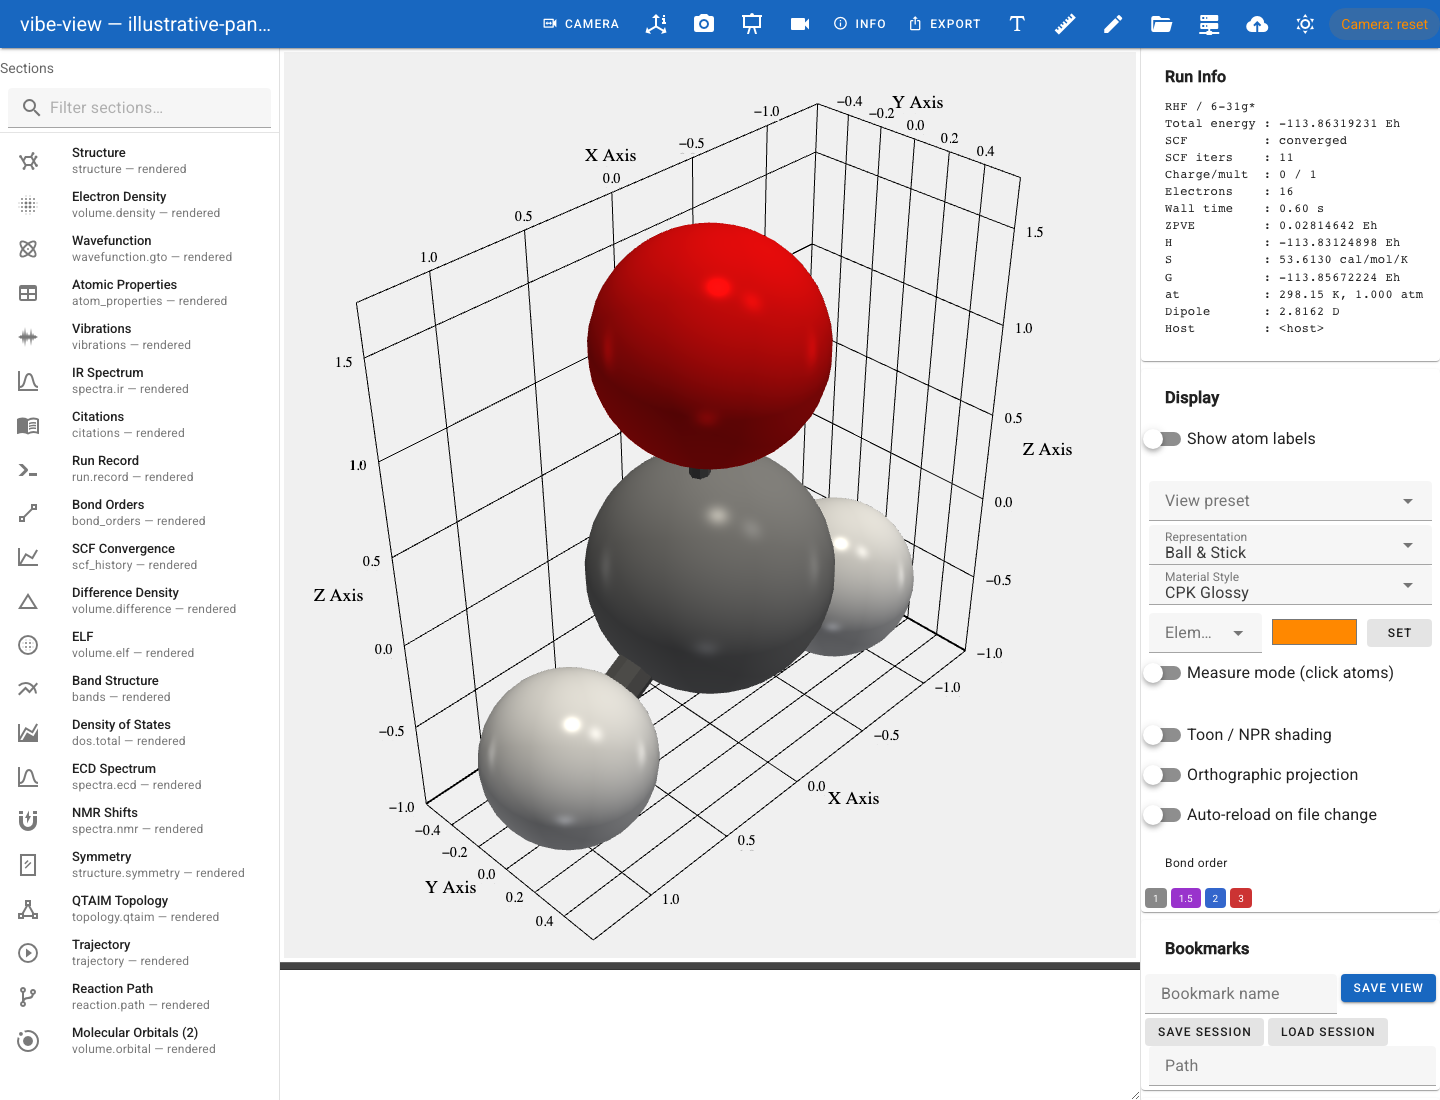
A normal mode from the formaldehyde calculation; playback moves the atoms along its displacement vectors.
Kind |
What you get |
|---|---|
|
Animated normal modes with a frequency selector |
|
Frame-by-frame geometry-optimisation playback with an energy plot |
|
Reaction paths, NEB images |
|
Relaxed and rigid scan surfaces |
|
SCF convergence, iteration by iteration |
vibe-view animate renders any of the animated kinds to MP4 or GIF without a
display.
Provenance
Kind |
What you get |
|---|---|
|
The references the producer says this calculation should cite |
|
What produced the file, with what settings |
|
The job that was submitted |
Which surface renders what
Every renderer is shared; the surfaces differ in how you drive them, not in what they can draw.
Browser |
Desktop |
TUI |
|
Headless |
Jupyter |
|
|---|---|---|---|---|---|---|
Structures |
✅ |
✅ |
✅ |
✅ |
✅ |
✅ |
Volumes / orbitals |
✅ |
✅ |
✅ |
✅ |
✅ |
✅ |
On-demand wavefunction evaluation |
✅ |
✅ |
✅ |
— |
SDK only |
— |
Bands / DOS / spectra / SCF |
✅ |
✅ |
✅ |
— |
✅ |
✅ |
Tables |
✅ |
✅ |
✅ |
— |
✅ |
✅ |
Editing, fragment library, crystal builder |
✅ |
✅ |
— |
— |
— |
— |
vq job panel |
✅ |
✅ |
— |
— |
— |
— |
Animation playback |
✅ |
✅ |
✅ |
— |
✅ (to file) |
— |
Needs a GL context |
✅ |
✅ |
— |
— |
offscreen |
— |
“SDK only” means what it says: vibe-view capture renders stored
volume.* sections and the orbital energy diagram, but has no flag for
evaluating an orbital on demand. vibeview.renderers.wavefunction.WavefunctionRenderer
does — evaluate_mo, evaluate_density, evaluate_spin_density,
evaluate_elf, evaluate_nci — so a script can do it headlessly even though
the CLI cannot.
The terminal surfaces deserve the emphasis: vibe-view tui gives you the 3-D
viewer, the charts and a selectable surface table as Unicode braille, over
plain SSH, with no display server, GL or X forwarding. It also plays
animations — step a trajectory or a normal mode with [ / ], or press play.
vibe-view show renders one frame and exits, and needs nothing beyond the
core install.
Each surface has its own page: the browser viewer and building and editing, terminal mode, the desktop app, and figures without a display for the headless commands and the capture API.
Import and export
Read: QVF, vibe-qc Python inputs (.py), XYZ, CIF, Cube, PDB, Mol2,
Gaussian input, GRO, SDF/Mol — built in. The [ase] extra adds the long tail
via ase.io.read. Third-party importer plugins are supported.
vibe-view formats lists what your installation can read, and --json
makes that scriptable.
Write: XYZ, CIF, CML, JSON, Python input, OBJ, glTF, POV-Ray scene,
Blender scene, standalone HTML, SVG, PDF — twelve formats through
vibe-view export. Volumes and figures go out as PNG through capture and
batch, and animations as MP4 or GIF through animate.
Convert: vibe-view import turns any readable loose file into a
persistent QVF archive, which is worth doing when you want the integrity
guarantees and the section model rather than a bare geometry.
What each importer keeps, and how to write one for a format that is not in the list, is on Input formats and interoperability. Cartoon rendering, chains, residues and B factors are on Biomolecules.